Light Curves and Difference Imaging Data
Below are light curves and difference imaging videos for a subset of galaxies from Baldassare, Geha, and Greene (2018) with AGN-like variability.
For each galaxy, we show the following:
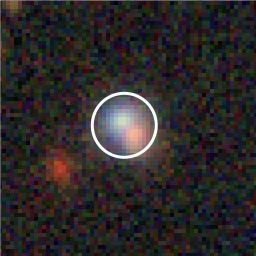
Image from the DECaLs image server (legacysurvey.org), with the 2.5" nuclear aperture over-plotted.
Video showing the difference images of the galaxy. Difference images are generated using a slightly modified version of the difference imaging pipeline DIAPL2 (Wozniak 2000). The two apertures shown on the difference images are a circle with radius of 2.5" (the nucleus), and an aperture for the full galaxy, generated from the elliptical Petrosian parameters derived in the NASA-Sloan Atlas.
Nuclear light curve, calculated within the central 2.5" aperture. The gray points are the data, the blue solid line shows the best fit damped random walk model from QSO_fit (Butler & Bloom 2011), and the light blue shaded region shows the model uncertainties.
NSA 40018

Stellar mass: 7.8e9 Msun
Redshift: 0.107
BPT position: AGN

NSA 32653

Stellar mass: 2.9e9 Msun
Redshift: 0.114
BPT position: AGN

NSA 305046

Stellar mass: 6.3e9 Msun
Redshift: 0.091
BPT position: AGN

NSA 214788

Stellar mass: 1.6e9 Msun
Redshift: 0.058
BPT position: Star forming

NSA 217124
Stellar mass: 2.8e8 Msun
Redshift: 0.041
BPT position: Star forming

NSA 35245

Stellar mass: 1.7e9 Msun
Redshift: 0.075
BPT position: Star forming
